

Read the Leading tab
The Leading view lists one card per leading goal. A leading goal is one of two kinds. A winning behavior is a goal where more is better: the day is won when the count reaches the target. An opportunity is a goal where less is better: the day is won when the count stays at or under the limit. Each +1 logged on a goal is an entry. At the top, Today’s scoreboard totals the day: winning entries on the left, opportunity entries on the right, and between them how many goals are on target. Only goals counted by hand add to the two totals; a goal Levelset counts automatically still counts toward the goals on target.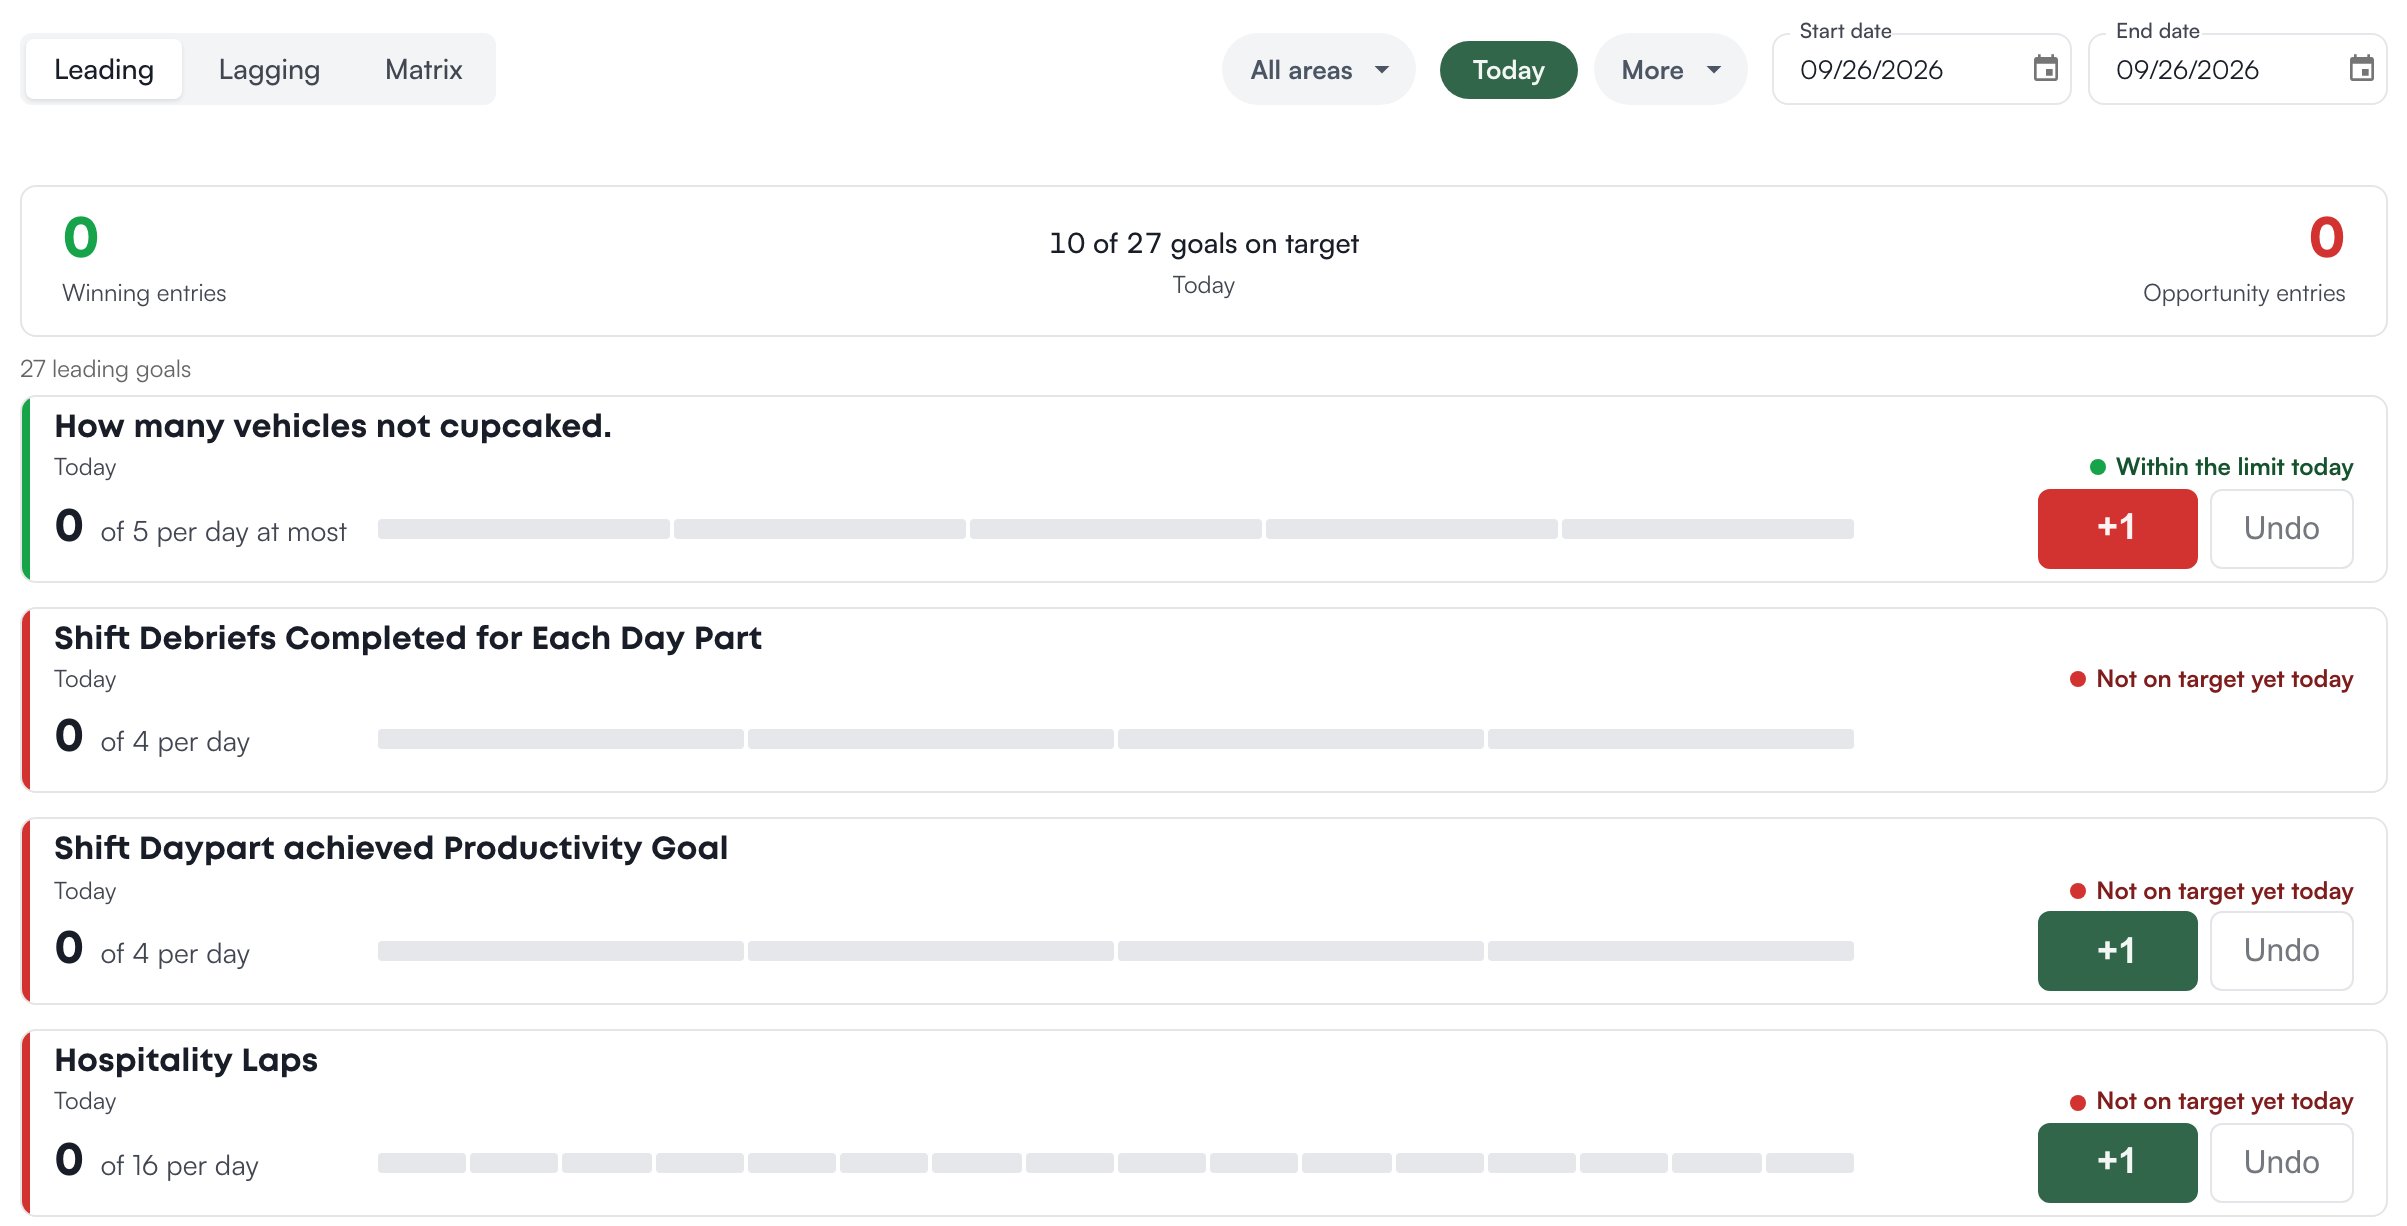
Log a tally
A leading goal counted by hand (Tally in its editor) has +1 and Undo buttons on its card and on its page. Click +1 each time the behavior happens; the count, the rectangles and every scoreboard showing the goal move at once. Undo takes back the last tally you logged today. It never removes another person’s tally: if you have none today, the page says Nothing of yours to undo today. A goal counted automatically (Auto tracked) has no buttons. Its count comes from what the team already records in Levelset, for example positional excellence ratings submitted or routines completed that day, and its page says Counted automatically from the source. If you don’t see +1, your role doesn’t log tallies. Ask your manager. Anyone with the permission Goals > Enter Results can tally; otherwise your organization keeps a list of the roles that can, which starts as the four roles at the top of your organization’s role order. A person without the buttons still sees every count.Read the Lagging tab
The Lagging view lists one card per lagging goal you can see. Each card shows the period the number reports (This month, or a finished period such as August), the value against the target (84% of 85%), the number of survey responses when the goal has them, and a trend line over the timeframe. One result in the timeframe shows as a bar on the goal’s scale instead of a line. The default timeframe is Last 90 days, because monthly reports land after the month closes and a short window would leave most cards empty.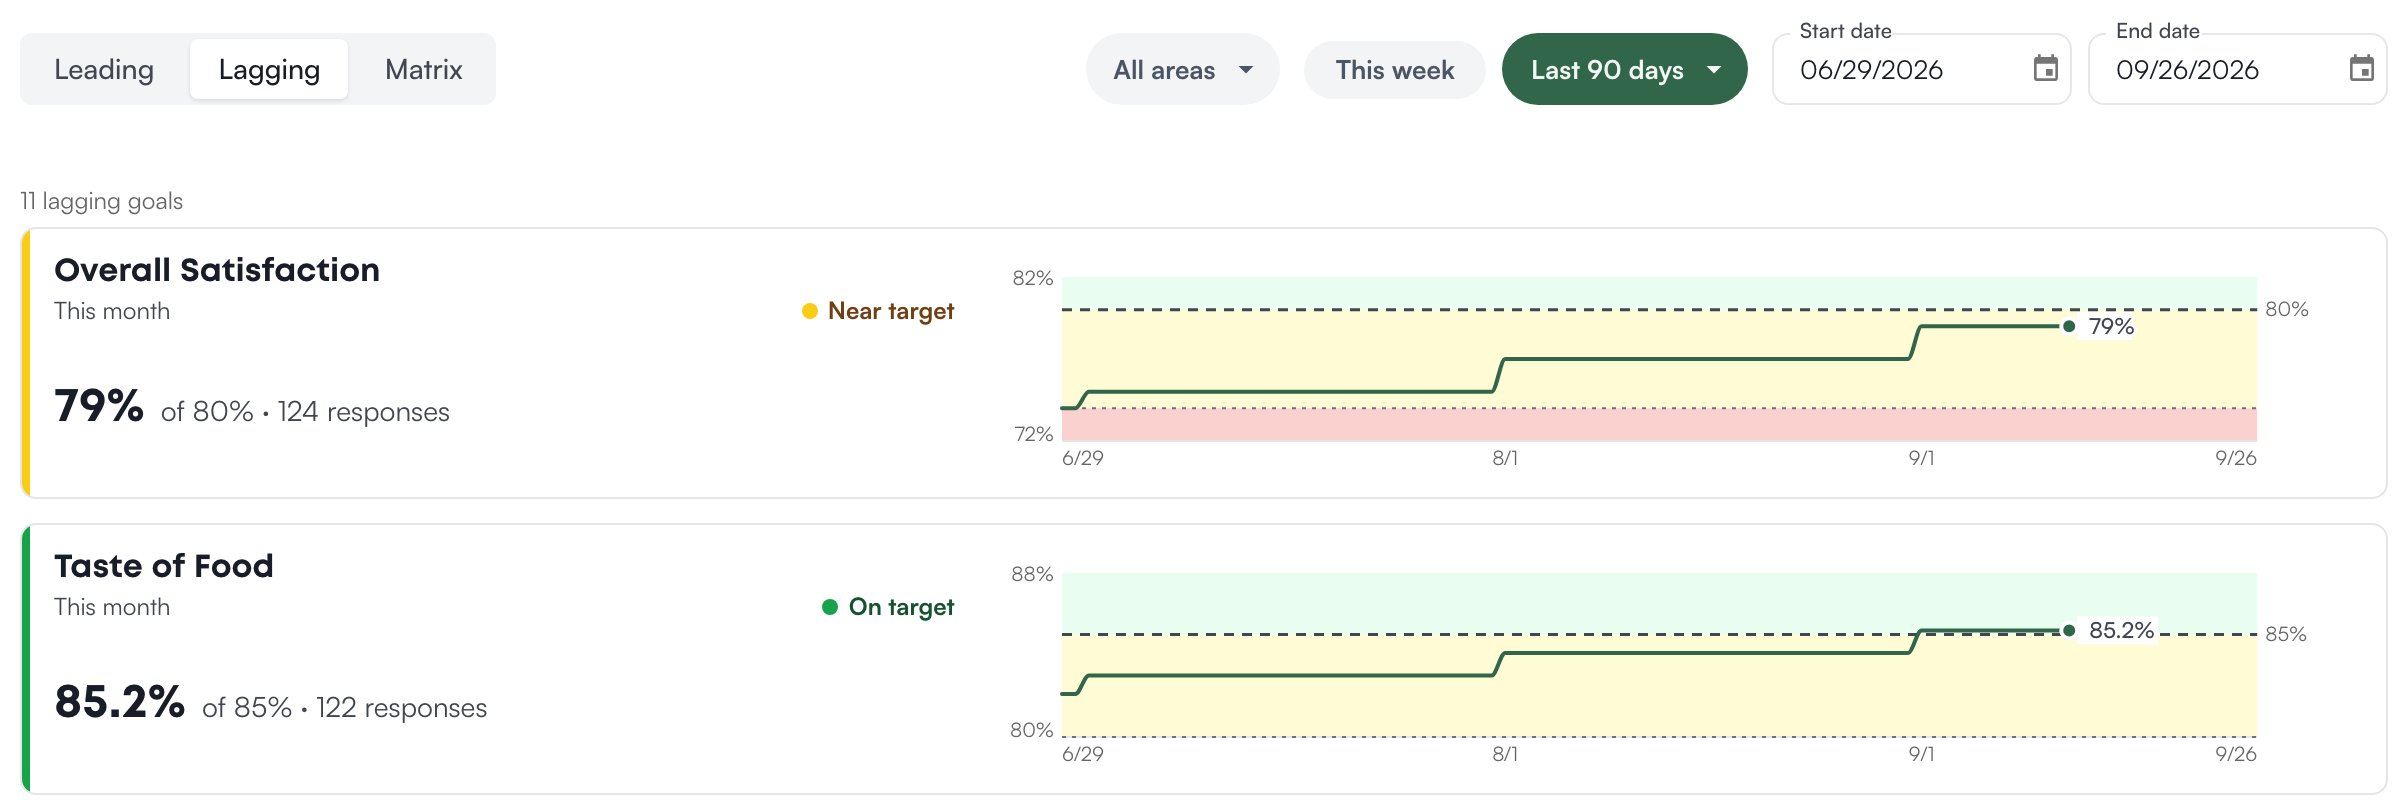
Connect goals on the Matrix
The Matrix view draws leading goals in a column on the left and lagging goals on the right, with an arrow from each goal to the result it drives. Each arrow takes the color of the goal it starts from, so a red arrow into a result means the daily goal feeding that result is losing.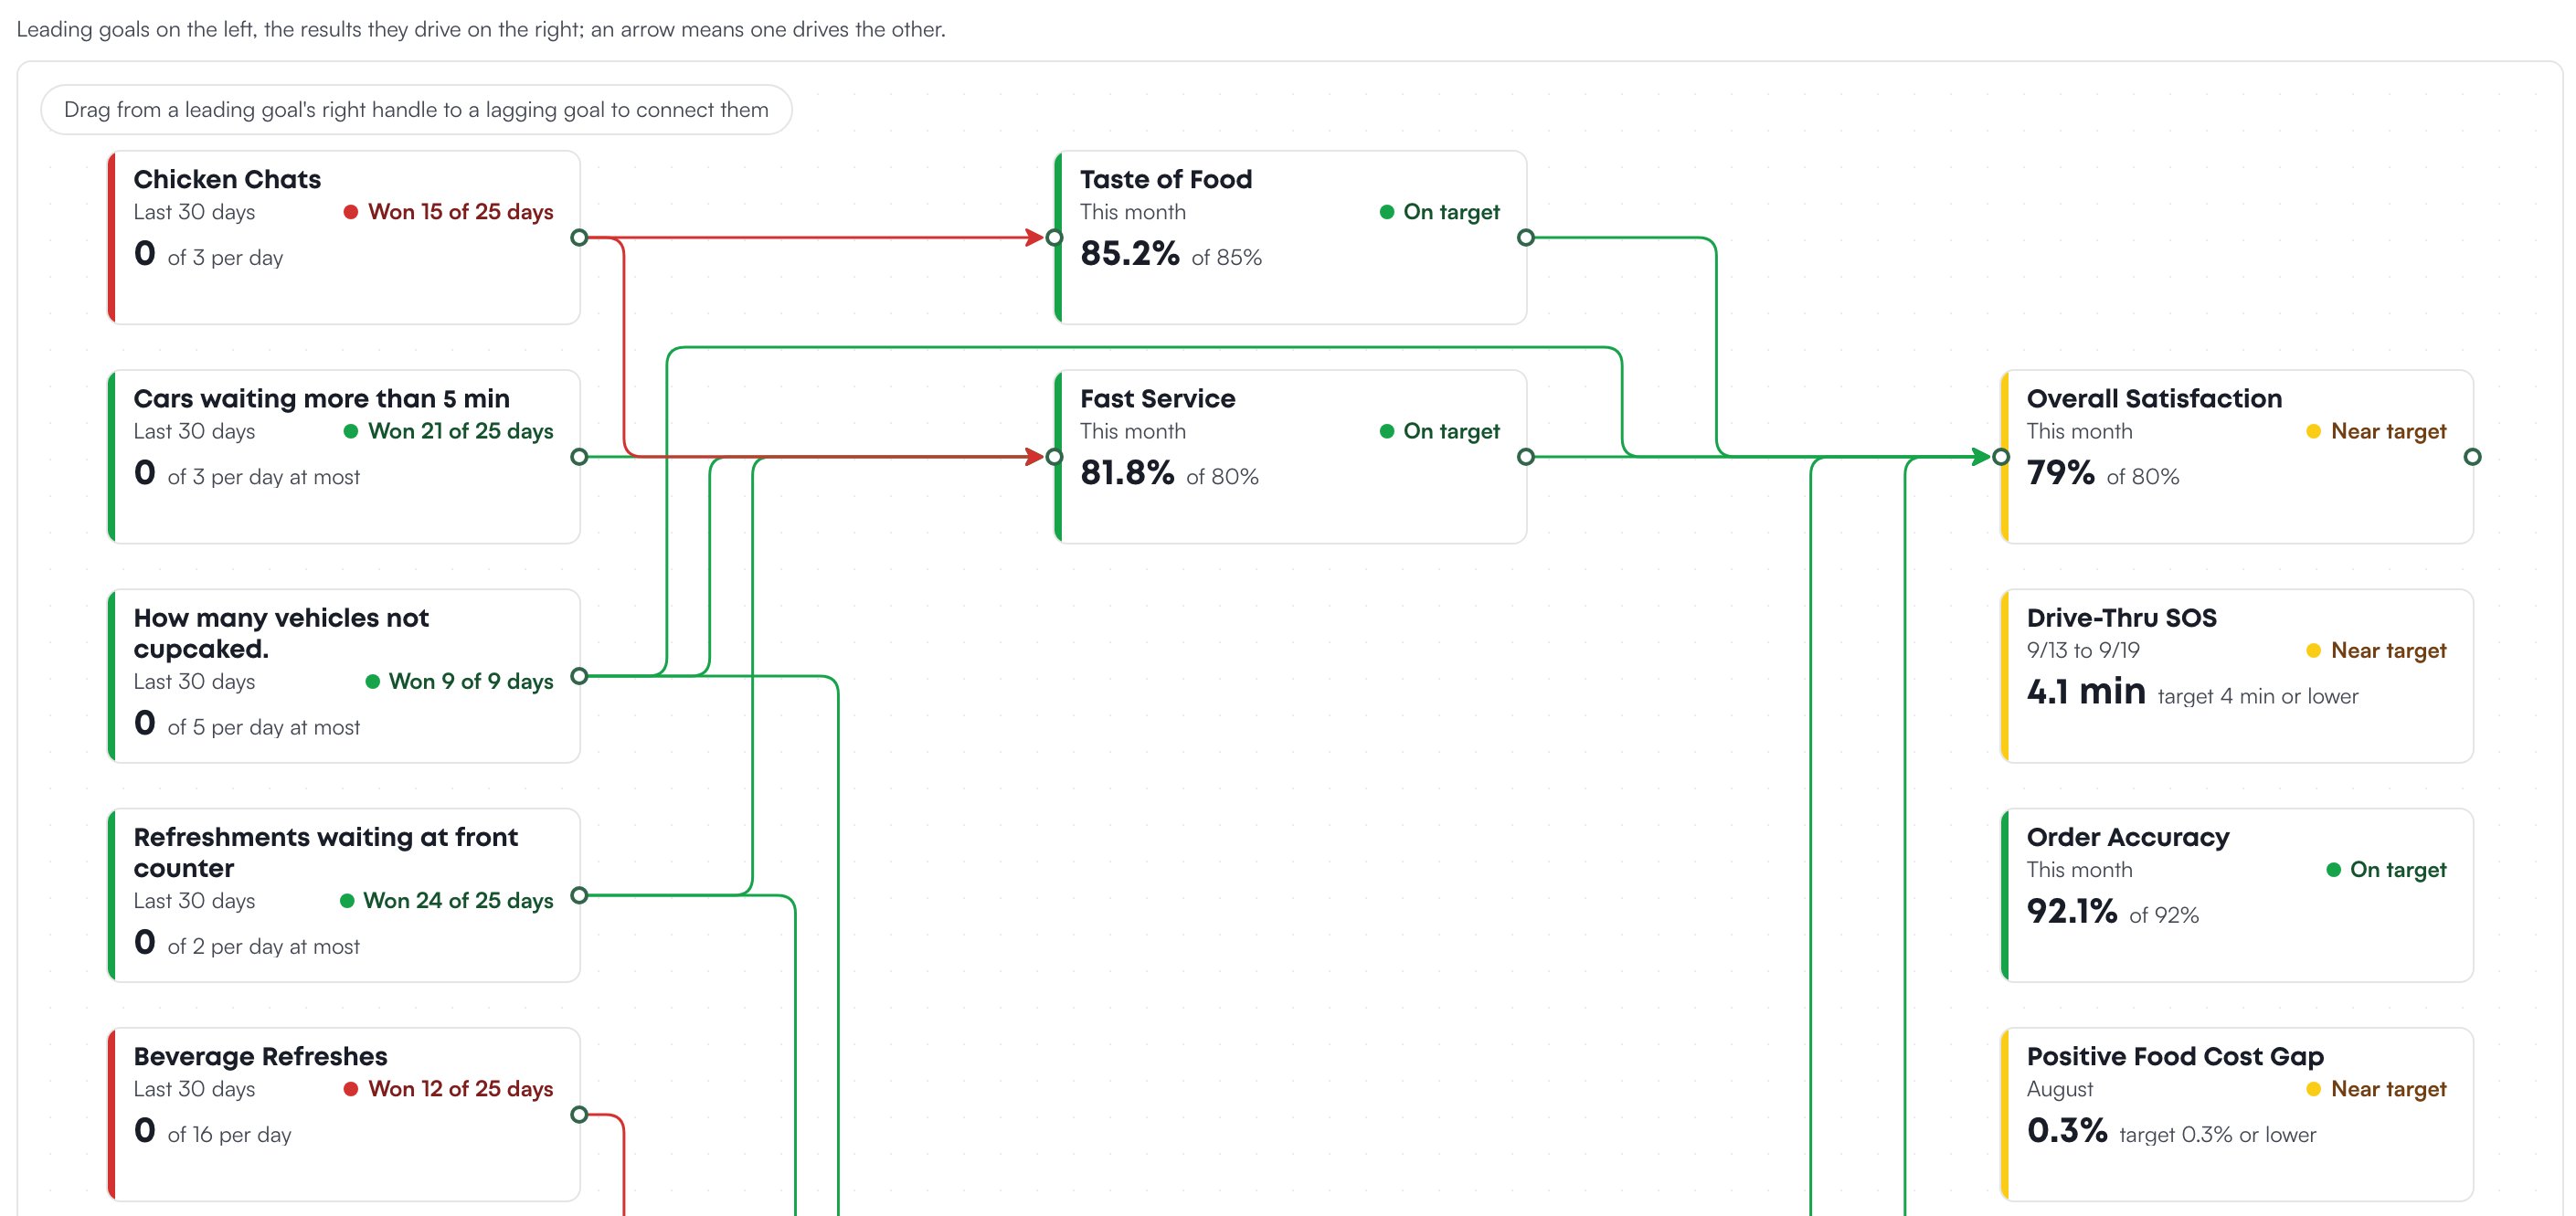
Open a goal
Click a goal’s name to open its page. Back to goals returns to the list on the same timeframe. A leading goal’s page shows Today: the count against the target, the +1 and Undo buttons when your role can tally, Days won and Won rate over the timeframe, and a pace line: Winning the range when the won rate meets your organization’s target, Close within ten points of it, Losing the range below that. History charts the days won and lost; change its timeframe with the control beside it. Today’s tallies lists who logged each tally and when, or Team when the goal does not track who logged it. A lagging goal’s page shows the current period’s value and where it came from (from 2 reports, from the 8/1/26 to 8/31/26 report), a Trend chart, the Target, the Minimum acceptable value (labeled Floor on this page), and the Benchmark when set (a reference line you type in, such as a top store’s figure). Under the chart, Coverage marks which days in the timeframe a report has covered, so you can see at a glance whether the number rests on the whole period or on part of it; To fill the gaps names the missing report. Both are explained in Read the coverage. Results lists every report entered, with its Window, Value, Responses, Vs previous, Source and the date it was Entered; tick Show replaced results to see results a later report replaced. Fewer than five responses is flagged low response count.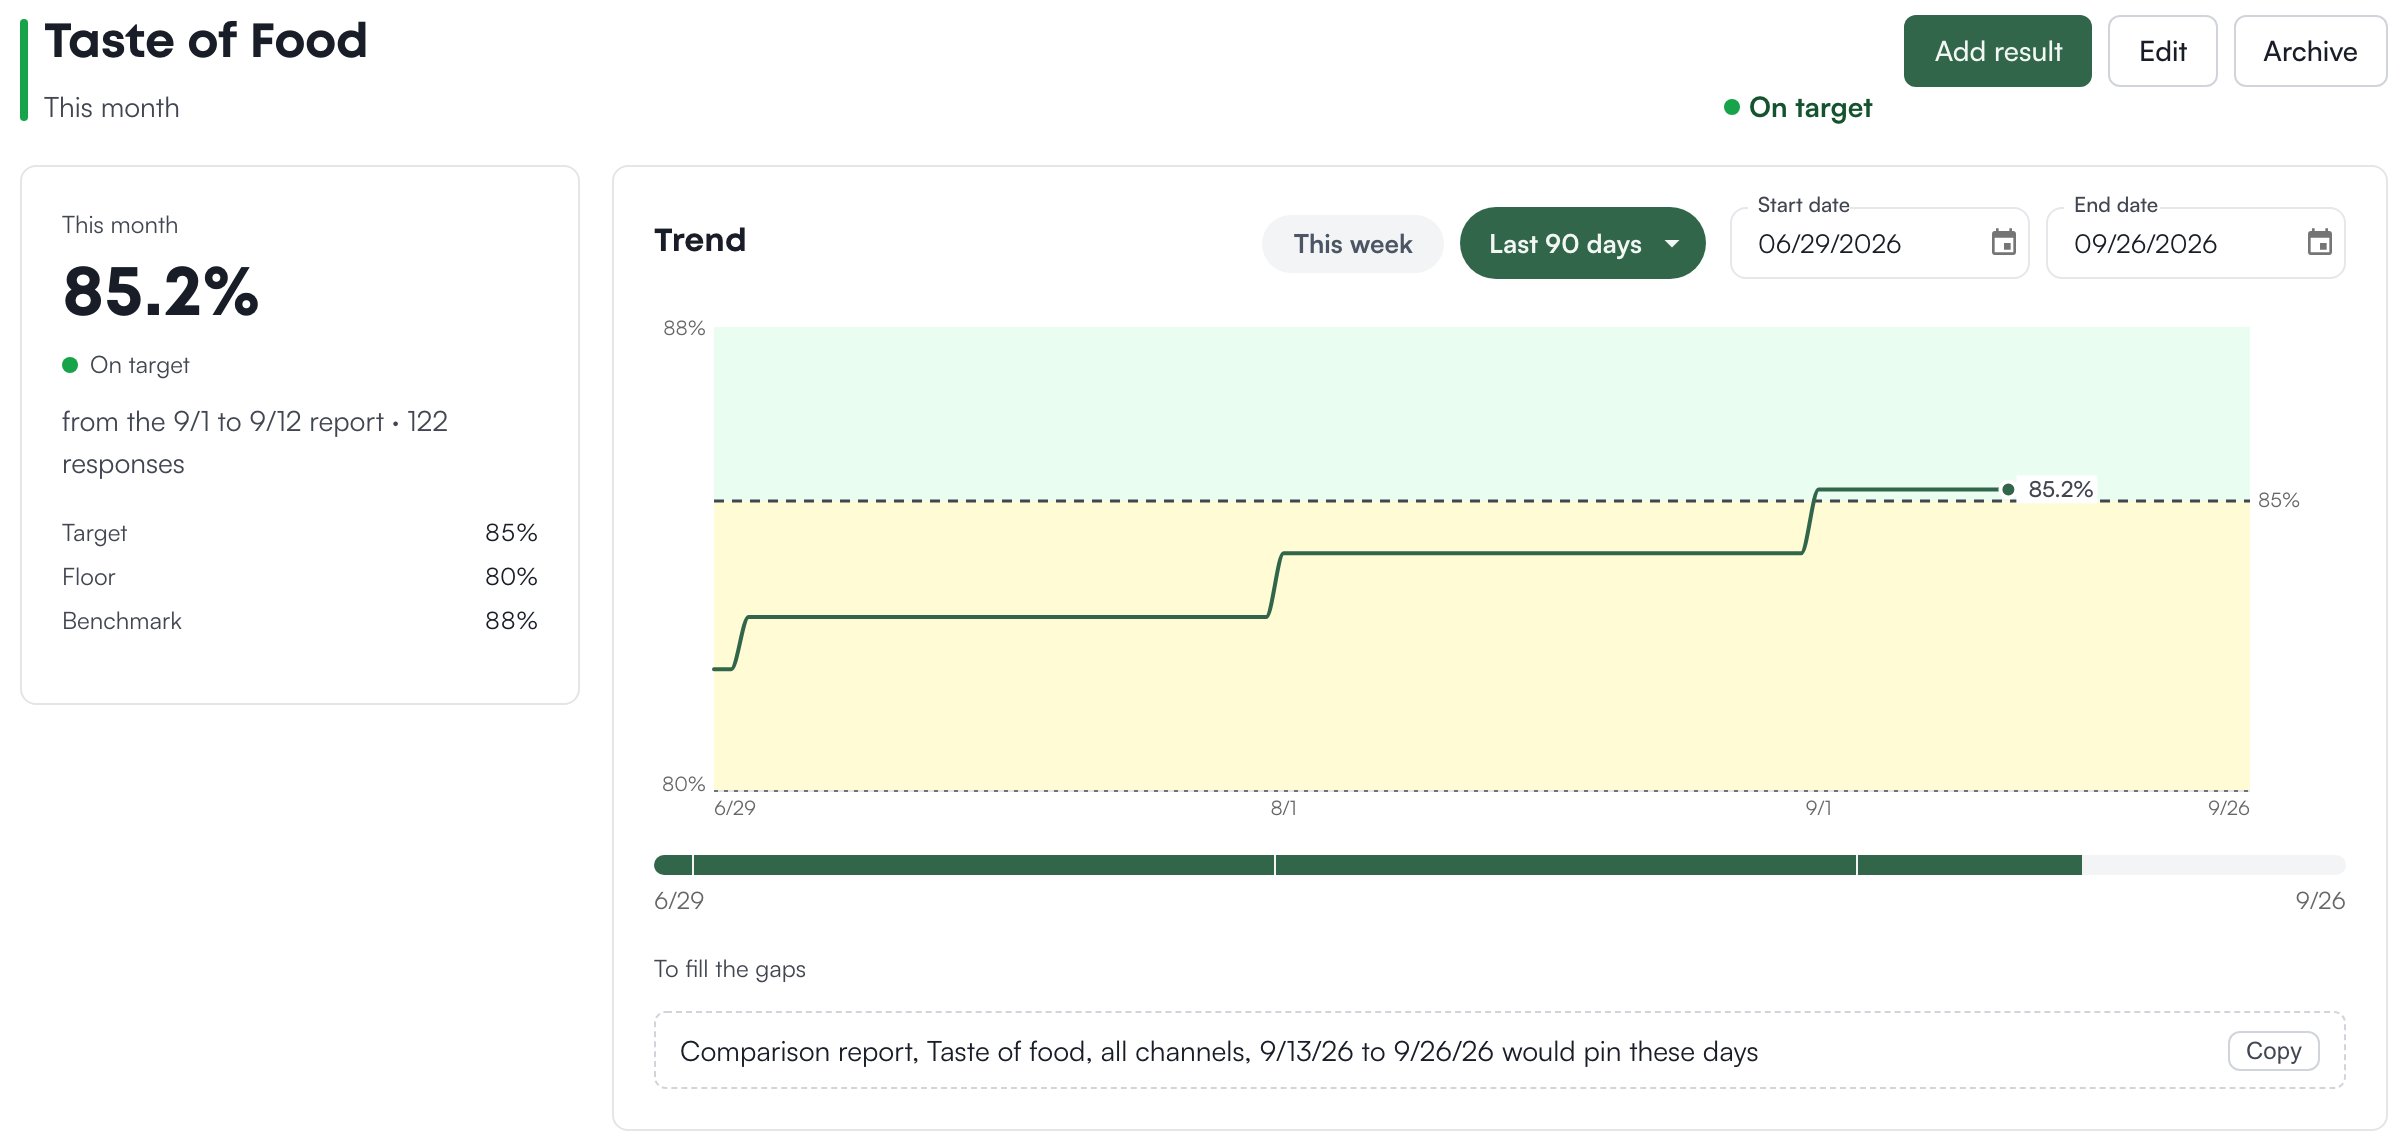
Who can do what
If a view or a button described on this page is missing for you, this table names the permission behind it.
If you’re missing something here, ask whoever manages roles in your organization.
Common questions
Why is my leading goal red this morning?
Why is my leading goal red this morning?
On the Today timeframe a winning goal is red until the day’s target is reached. Pick a longer timeframe to see the won rate instead.
A lagging card says No results yet.
A lagging card says No results yet.
No report covering the current period has been entered. Open the goal and use Add result, or Add data on the Lagging view. See Add data.
Can I see another store's goals?
Can I see another store's goals?
Pick the store at the top of the dashboard. A goal created with This location only unticked applies to every store and shows at each one with that store’s own numbers.